

Table of Contents
What is the Smart Money Concept?
The Smart Money Concept (SMC) is a trading methodology based on the idea that large financial institutions control most market movements. These include banks, hedge funds, central banks, and large investment firms.
According to this concept, institutional traders leave footprints on price charts. By analysing these footprints, traders can predict market direction and align their trades with smart money.
Instead of simply relying on indicators, SMC focuses on market structure, liquidity, supply and demand zones, and institutional order flow.
The core idea is simple:
Retail traders often react to price movements, while smart money creates those movements.
By analysing price behaviour carefully, traders attempt to identify where large institutions are entering or exiting the market.
Role of Smart Money in Financial Markets
Large institutions trade with enormous capital. Because of the size of their orders, they cannot enter the market randomly without affecting price.
To manage this, institutions often accumulate or distribute positions gradually. During this process, they may trigger retail traders’ stop-loss orders or create liquidity before pushing the market in their desired direction.
Examples of smart money participants include:
- Major banks
- Hedge funds
- Central banks
- Investment institutions
- Large corporations and governments
These participants influence market direction due to the volume of capital they control.
Key Concepts of Smart Money Concept (SMC)
SMC trading introduces several unique concepts that help traders interpret institutional activity.
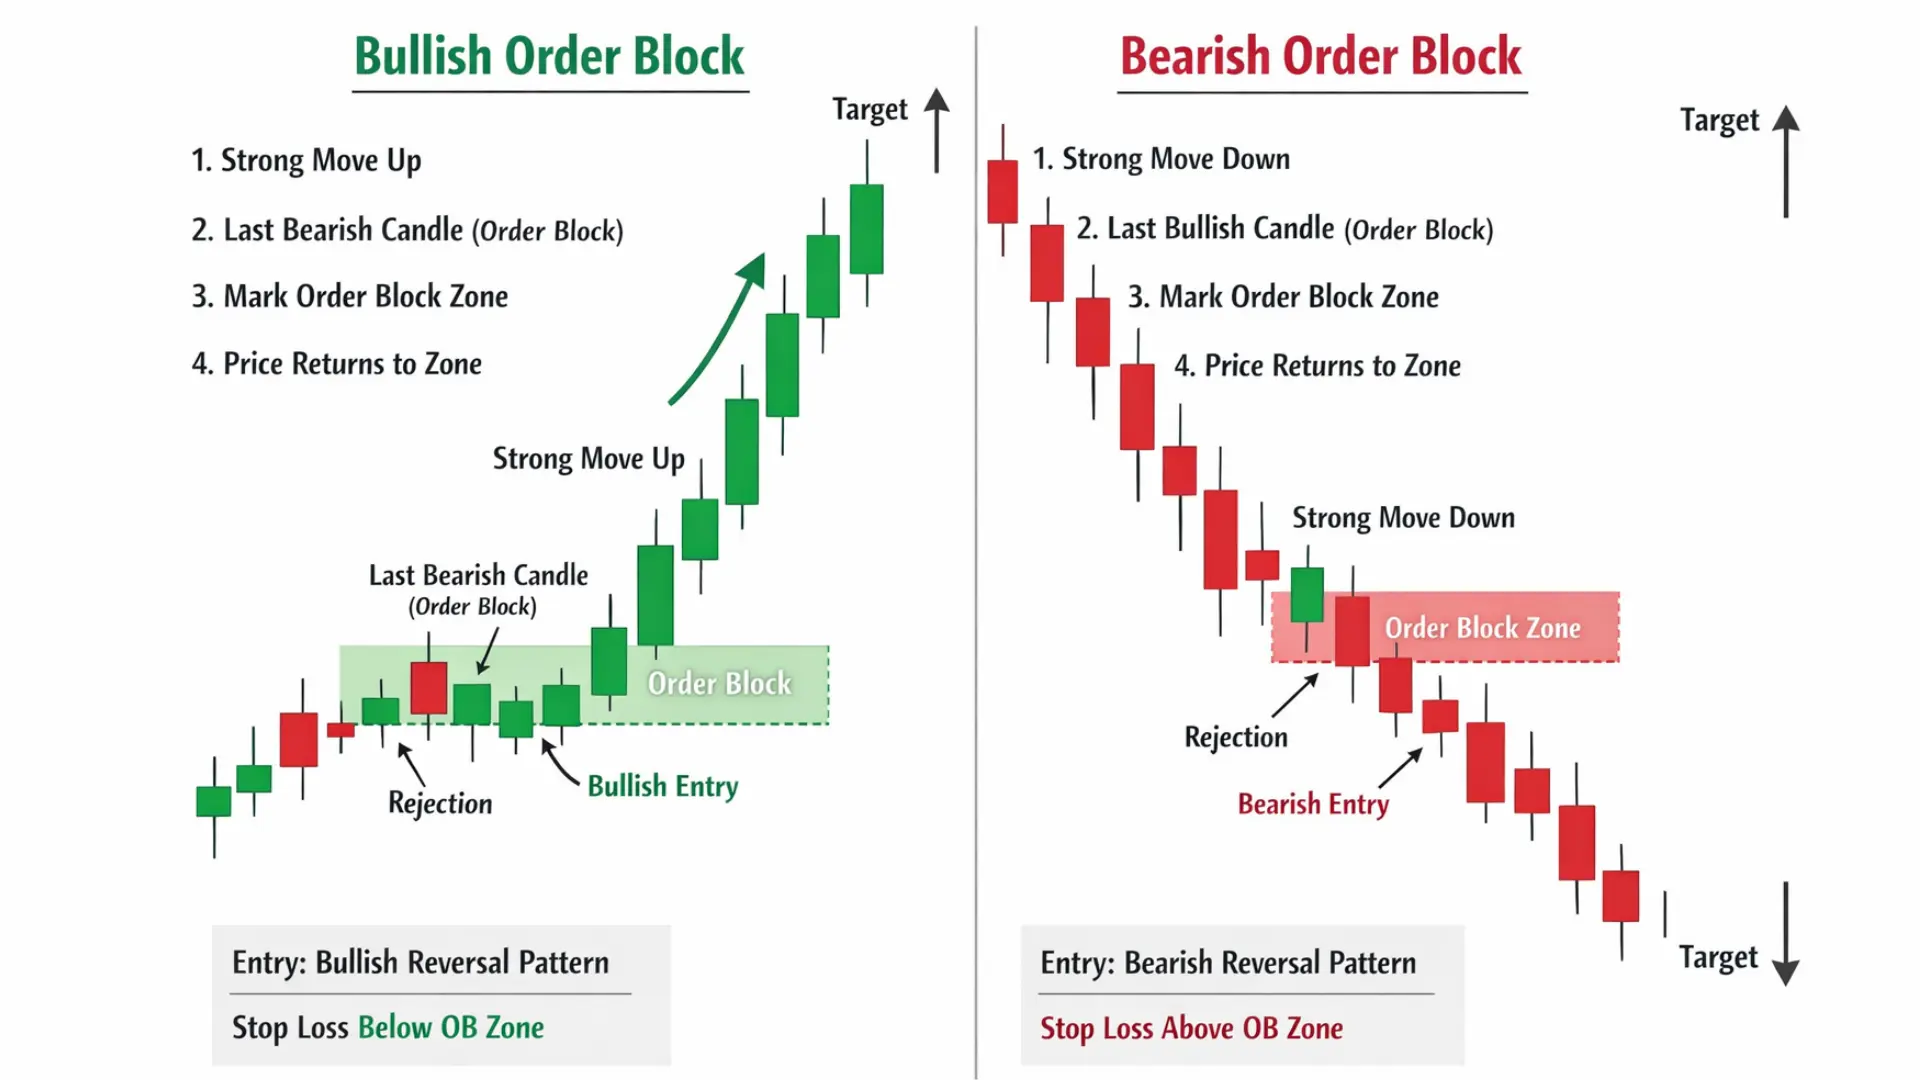
1. Order Blocks (OB)
Order blocks are zones where large institutions have placed significant buy or sell orders.
These areas often represent supply and demand zones where price previously showed strong reactions.
Characteristics of Order Blocks:
- Often appear before strong market moves
- Represent institutional accumulation or distribution
- Act as potential support or resistance areas
Traders frequently wait for the price to return to these zones to enter trades.
2. Breaker Blocks
Breaker blocks occur when an order block fails.
If a price breaks through a previously strong support or resistance area, that level may reverse its role.
For example:
A broken support level may become resistance
A broken resistance level may become support
These levels can offer potential entry opportunities for traders.
3. Fair Value Gap (FVG)
A Fair Value Gap (FVG) is created when the market moves quickly and leaves an imbalance between buyers and sellers.
This often appears as a gap or inefficient price movement between candles.
SMC traders believe that prices frequently return to these gaps to rebalance the market before continuing its trend. 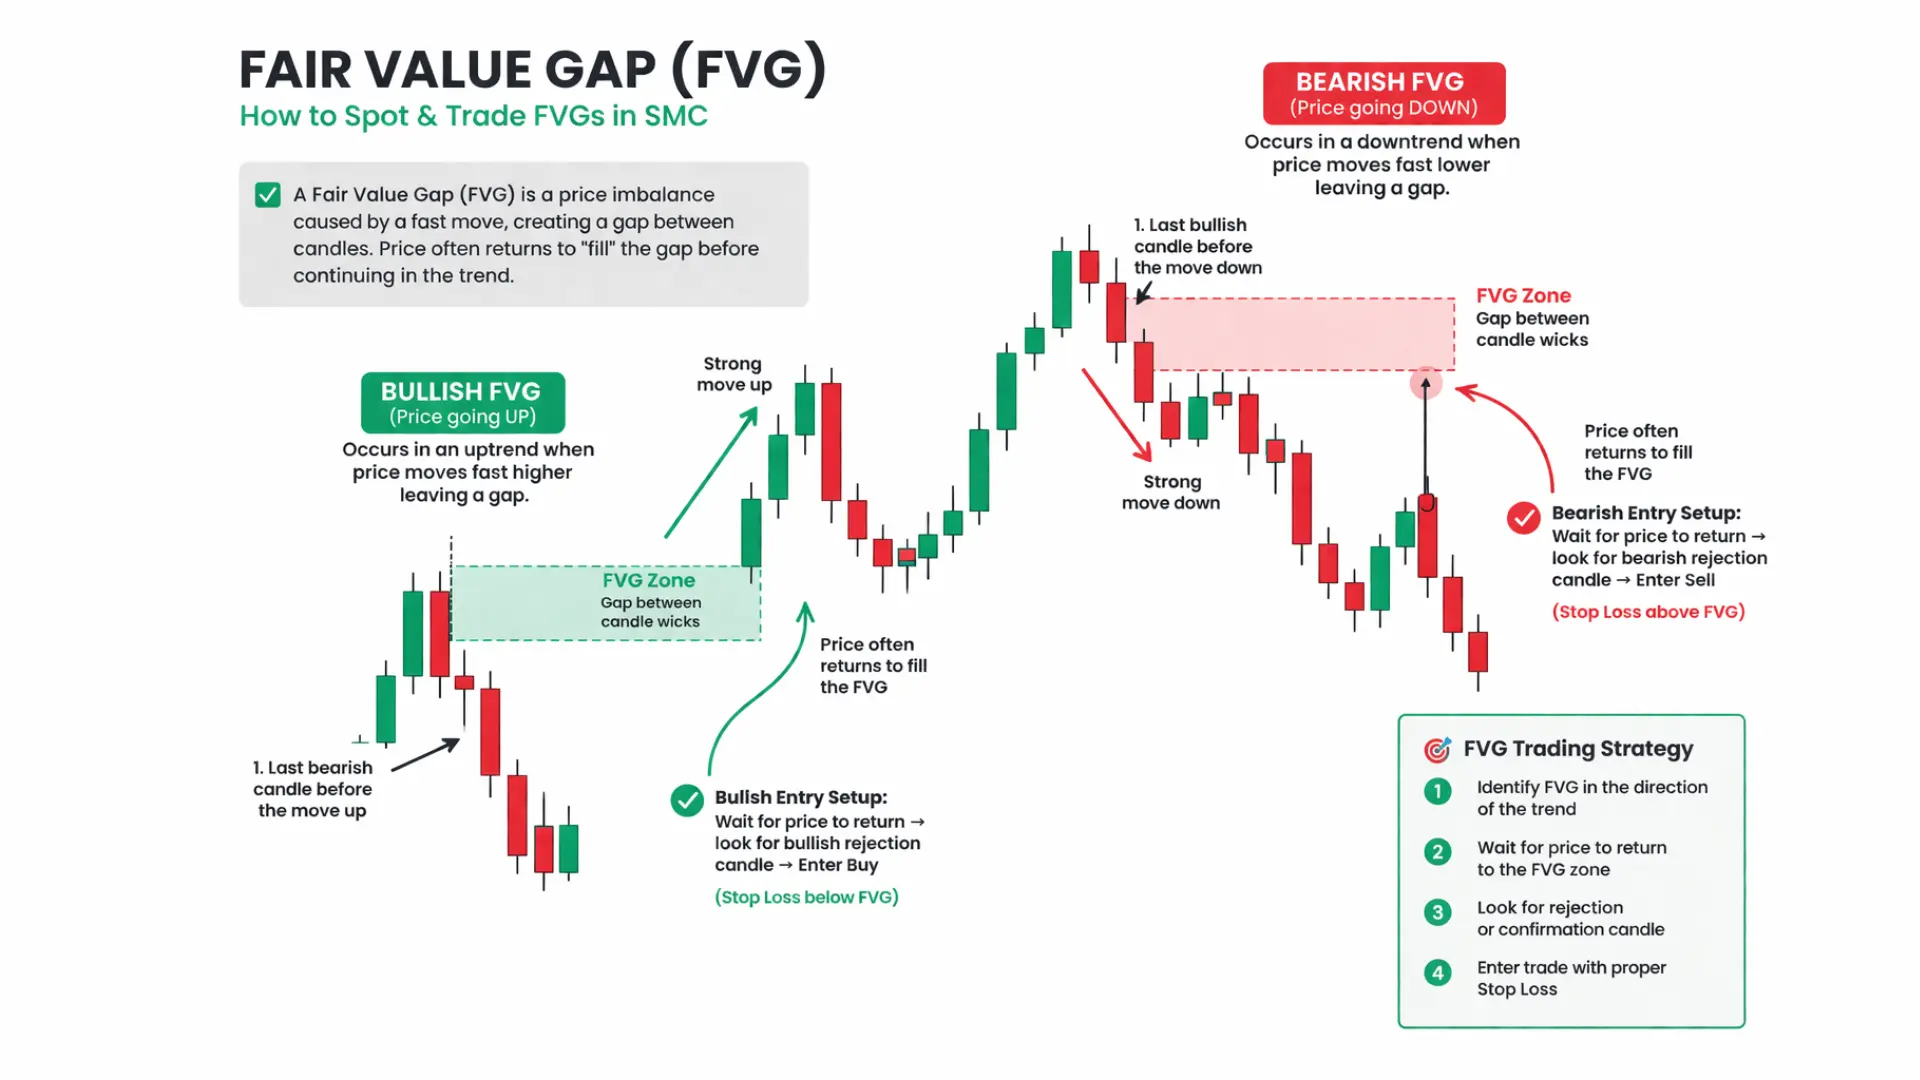
4. Break of Structure (BOS)
A break of structure occurs when price breaks a previous high or low, signalling a shift in market structure.
For example:
Higher highs and higher lows indicate an uptrend
Lower highs and lower lows indicate a downtrend
When a price breaks a key structure level, it often confirms the continuation of a trend.
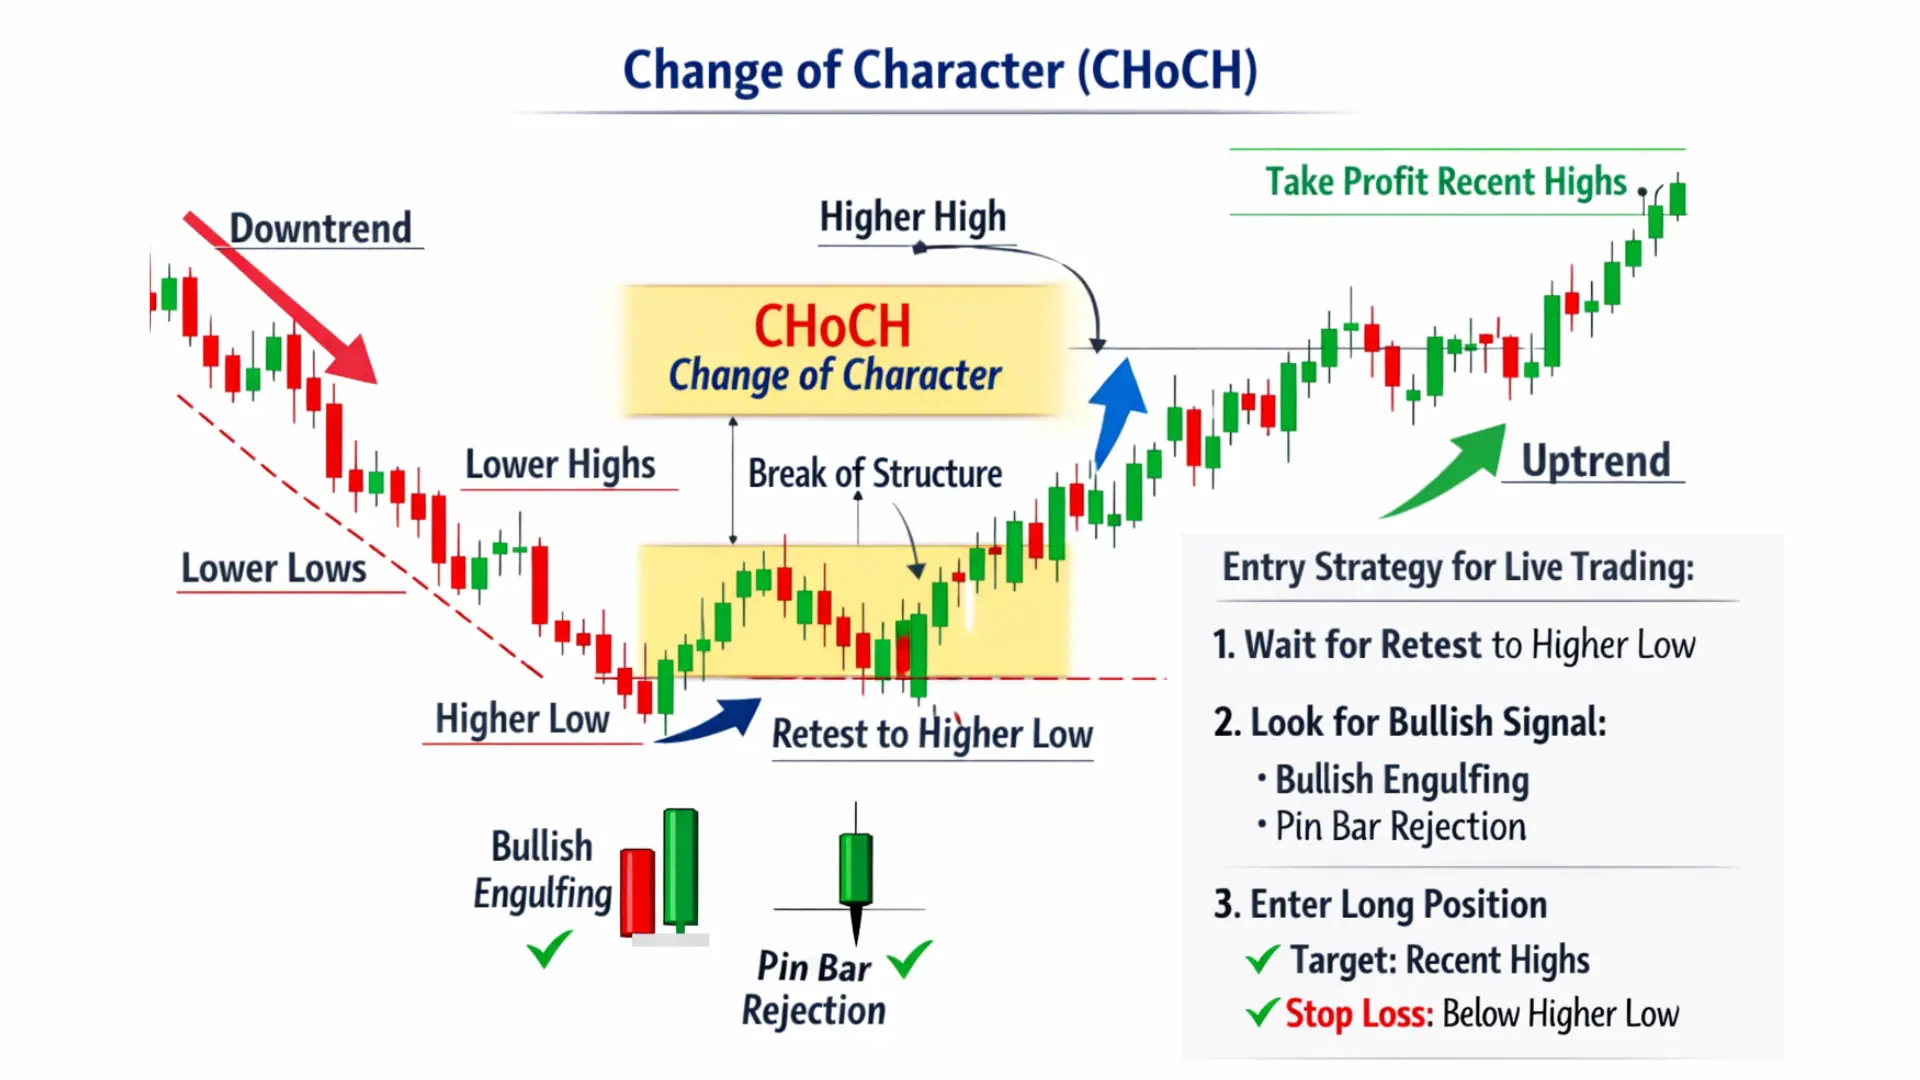
5. Change of Character (CHoCH)
A change of character signals a possible trend reversal.
It occurs when price behaviour changes suddenly, showing weakness in the current trend.
For example:
A market that was making lower lows suddenly forms a higher high
This indicates potential bullish momentum
Traders use CHOCH to identify early trend shifts.
6. Liquidity
Liquidity refers to areas where large numbers of stop-loss orders or pending orders exist.
Common liquidity zones include:
Equal highs
Equal lows
Double tops
Double bottoms
Trendline levels
Major support and resistance zones
Institutions often push price toward these areas to collect liquidity before moving the market in the opposite direction.
How to Trade Using the Smart Money Concept
Trading with SMC generally follows a structured process.
Step 1: Identify the Market Trend
The first step is analysing market structure.
Look for:
Higher highs and higher lows → Uptrend
Lower highs and lower lows → Downtrend
If the structure changes, it may indicate a trend reversal.
Step 2: Locate High-Probability Order Blocks
Once the trend is identified, traders look for institutional order blocks.
These zones often act as the following:
Support in an uptrend
Resistance in a downtrend
Combining order blocks with liquidity zones and fair value gaps increases trade probability.
Step 3: Plan Entry and Exit Points
After identifying a valid zone, traders define the following:
Entry: Near the order block
Stop Loss: Below or above the zone
Take Profit: Near previous market highs or lows
Risk management remains essential when using any trading strategy.
Smart Money Concept vs Price Action
| Factor | Smart Money Concept | Price Action |
|---|---|---|
| Approach | Institutional Perspective | Chart-based |
| Focus | Liquidity & Order Flow | Candlestick Patterns |
| Goal | Follow Smart Money | Predict Price |
| Complexity | Moderate | Beginner Friendly |
Advantages & Disadvantages
Advantages
- Deep market understanding
- High probability zones
- Works in all markets
- Structured strategy
Disadvantages
- Complex for beginners
- Requires practice
- No guaranteed results
Does SMC Really Work?
SMC can be effective when used correctly with proper risk management. It is not a guaranteed system and requires discipline and experience.
Conclusion
The Smart Money Concept is a powerful way to understand market behavior. It helps traders follow institutional activity, identify liquidity, and make informed decisions.
 Trading Strategy – Complete Guide&media=https://r2.mutualfundipo.app/blogpost/smart-money-concept.webp)